
Pandas는 데이터 세트 작업에 사용되는 Python 라이브러리입니다.
데이터를 분석, 정리, 탐색 및 조작하는 기능이 있습니다.
"Pandas"라는 이름은 "Panel Data"와 "Python Data Analysis"를 모두 참조하며 2008년 Wes McKinney가 만들었습니다.
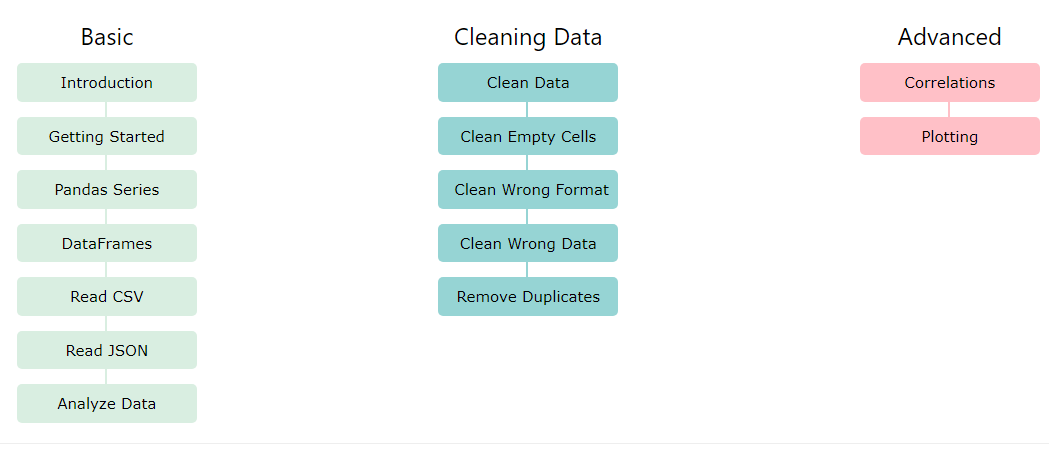
Pandas에 대해 자세히 알아볼 수 있도록 14개의 튜토리얼 페이지를 만들었습니다.
기본 소개로 시작하여 데이터 정리 및 플로팅으로 끝납니다.
판다스의 데이터 유형
1. Pandas Series
Pandas Series는 테이블의 열과 같습니다.
모든 유형의 데이터를 보유하는 1차원 배열입니다
2. 데이터프레임이란?
Pandas DataFrame은 2차원 배열 또는 행과 열이 있는 테이블과 같은 2차원 데이터 구조입니다.
CSV 파일 읽기
빅 데이터 세트를 저장하는 간단한 방법은 CSV 파일(쉼표로 구분된 파일)을 사용하는 것입니다.
CSV 파일은 일반 텍스트를 포함하며 Pandas를 포함한 모든 사람이 읽을 수 있는 잘 알려진 형식입니다.
예제에서는 'data.csv'라는 CSV 파일을 사용합니다.
data.csv를 다운로드 합니다. 또는 data.csv 열기
예시
import pandas as pd

df = pd.read_csv('data.csv')

print(df)
행이 많은 큰 DataFrame이 있는 경우 Pandas는 처음 5개 행과 마지막 5개 행만 반환합니다.
예시
to_string() 메서드 없이 DataFrame을 인쇄합니다 .
import pandas as pd

df = pd.read_csv('data.csv')

print(df)
max_rows
반환되는 행 수는 Pandas 옵션 설정에서 정의됩니다.
명령문 을 사용하여 시스템의 최대 행 수를 확인할 수 있습니다 pd.options.display.max_rows.
예시
반환된 최대 행 수를 확인합니다.
import pandas as pd

print(pd.options.display.max_rows)
내 시스템에서 숫자는 60입니다. 즉, DataFrame에 60개 이상의 행이 포함된 경우 print(df)명령문은 헤더와 처음 및 마지막 5개 행만 반환합니다.
동일한 명령문으로 최대 행 수를 변경할 수 있습니다.
예시
전체 DataFrame을 표시하려면 최대 행 수를 늘립니다.
import pandas as pd

pd.options.display.max_rows = 9999

df = pd.read_csv('data.csv')

print(df)
출입국관광통계서비스 활용 실습
다운로드 : https://www.data.go.kr/data/15099982/fileData.do
법무부_1(출입국심사)연도별 출입국자 현황_20211231
2011년부터 2021년까지 연도별 출국 및 입국심사 완료된 출입국자 수를 국민과 외국인으로 분류 하여 제공 (연도, 출입국구분, 내외국인 여부, 출입국자수)
www.data.go.kr
Q1. 다운받은 CSV파일을 코랩을 이용하여 수집하는 프로그램을 작성해 보세요!
Pandas - DataFrames 분석
데이터 보기
DataFrame의 빠른 개요를 얻기 위해 가장 많이 사용되는 방법 중 하나는 head()방법입니다.
이 head()메서드는 맨 위에서 시작하여 헤더와 지정된 수의 행을 반환합니다.
예시
DataFrame의 처음 10개 행을 인쇄하여 빠른 개요를 얻으십시오.
import pandas as pd

df = pd.read_csv('data.csv')

print(df.head(10))
예제에서는 'data.csv'라는 CSV 파일을 사용합니다.
data.csv 를 다운로드 하거나 브라우저에서 data.csv 를 엽니다 .
참고: 행 수가 지정되지 않은 경우 head()메서드는 상위 5개 행을
반환합니다.
예시
DataFrame의 처음 5개 행을 인쇄합니다.
import pandas as pd

df = pd.read_csv('data.csv')

print(df.head())
DataFrame 의 마지막tail() 행 을 보는 방법 도 있습니다 .
이 tail()메서드는 맨 아래부터 시작하여 헤더와 지정된 수의 행을 반환합니다.
예시
DataFrame의 마지막 5개 행을 인쇄합니다.
데이터에 대한 정보
info()DataFrames 객체에는 데이터 세트에 대한 자세한 정보를 제공하는 이라는 메서드가 있습니다.
예시
데이터에 대한 정보 인쇄:
결과
  <클래스 'pandas.core.frame.DataFrame'>
  RangeIndex: 169 항목, 0 ~ 168
  데이터 열(총 4개 열):
   # 열 Null이 아닌 개수 Dtype
  --- ------ -------------- -----
   0 기간 169 null이 아닌 int64
   1 펄스 169 null이 아닌 int64
   2 Maxpulse 169 null이 아닌 int64
   3칼로리 164 non-null float64
  dtypes: float64(1), int64(3)
  메모리 사용량: 5.4KB
없음결과 설명
결과는 169개의 행과 4개의 열이 있음을 알려줍니다.
  RangeIndex: 169 항목, 0 ~ 168
  데이터 열(총 4개 열):
데이터 유형이 있는 각 열의 이름:
   # 열 Null이 아닌 개수 Dtype
  --- ------ -------------- -----
   0 기간 169 null이 아닌 int64
   1 펄스 169 null이 아닌 int64
   2 Maxpulse 169 null이 아닌 int64
   3칼로리 164 non-null float64
Null 값
또한 이 info()방법은 각 열에 얼마나 많은 Null이 아닌 값이 있는지 알려주며 데이터 세트에서 "칼로리" 열에 Null이 아닌 값이 169개 중 164개 있는 것처럼 보입니다.
즉, 어떤 이유로든 "칼로리" 열에 값이 전혀 없는 행이 5개 있다는 의미입니다.
빈 값 또는 Null 값은 데이터를 분석할 때 좋지 않을 수 있으므로 빈 값이 있는 행을 제거하는 것을 고려해야 합니다. 이것은 정리 데이터 라고 하는 단계이며 다음 장에서 이에 대해 자세히 알아볼 것입니다.
Pandas - 데이터 정리
데이터 정리
데이터 정리는 데이터 세트에서 잘못된 데이터를 수정하는 것을 의미합니다.
잘못된 데이터는 다음과 같습니다.
- 빈 셀
- 잘못된 형식의 데이터
- 잘못된 데이터
- 중복
이 자습서에서는 모든 문제를 처리하는 방법을 배웁니다.
데이터 세트
다음 장에서는 이 데이터 세트를 사용합니다.
      기간 날짜 맥박 Maxpulse 칼로리
  0 60 '2020/12/01' 110 130 409.1
  1 60 '2020/12/02' 117 145 479.0
  2 60 '2020/12/03' 103 135 340.0
  3 45 '2020/12/04' 109 175 282.4
  4 45 '2020/12/05' 117 148 406.0
  5 60 '2020/12/06' 102 127 300.0
  6 60 '2020/12/07' 110 136 374.0
  7 450 '2020/12/08' 104 134 253.3
  8 30 '2020/12/09' 109 133 195.1
  9 60 '2020/12/10' 98 124 269.0
  10 60 '2020/12/11' 103 147 329.3
  11 60 '2020/12/12' 100 120 250.7
  12 60 '2020/12/12' 100 120 250.7
  13 60 '2020/12/13' 106 128 345.3
  14 60 '2020/12/14' 104 132 379.3
  15 60 '2020/12/15' 98 123 275.0
  16 60 '2020/12/16' 98 120 215.2
  17 60 '2020/12/17' 100 120 300.0
  18 45 '2020/12/18' 90 112 NaN
  19 60 '2020/12/19' 103 123 323.0
  20 45 '2020/12/20' 97 125 243.0
  21 60 '2020/12/21' 108 131 364.2
  22 45 NaN 100 119 282.0
  23 60 '2020/12/23' 130 101 300.0
  24 45 '2020/12/24' 105 132 246.0
  25 60 '2020/12/25' 102 126 334.5
  26 60 2020/12/26 100 120 250.0
  27 60 '2020/12/27' 92 118 241.0
  28 60 '2020/12/28' 103 132 NaN
  29 60 '2020/12/29' 100 132 280.0
  30 60 '2020/12/30' 102 129 380.3
  31 60 '2020/12/31' 92 115 243.0
데이터 세트에는 일부 빈 셀(22행의 "Date" 및 18행과 28행의 "Calories")이 포함되어 있습니다.
데이터 세트에 잘못된 형식(26행의 "날짜")이 포함되어 있습니다.
데이터 세트에 잘못된 데이터가 포함되어 있습니다(7행의 "기간").
데이터 세트에 중복 항목(11행 및 12행)이 포함되어 있습니다.
판다스 - DataFrame 참조
DataFrame 개체의 모든 속성 및 메서드(설명 및 예 포함):
Property/MethodDescription
| abs() | Return a DataFrame with the absolute value of each value |
| add() | Adds the values of a DataFrame with the specified value(s) |
| add_prefix() | Prefix all labels |
| add_suffix() | Suffix all labels |
| agg() | Apply a function or a function name to one of the axis of the DataFrame |
| aggregate() | Apply a function or a function name to one of the axis of the DataFrame |
| align() | Aligns two DataFrames with a specified join method |
| all() | Return True if all values in the DataFrame are True, otherwise False |
| any() | Returns True if any of the values in the DataFrame are True, otherwise False |
| append() | Append new columns |
| applymap() | Execute a function for each element in the DataFrame |
| apply() | Apply a function to one of the axis of the DataFrame |
| assign() | Assign new columns |
| astype() | Convert the DataFrame into a specified dtype |
| at | Get or set the value of the item with the specified label |
| axes | Returns the labels of the rows and the columns of the DataFrame |
| bfill() | Replaces NULL values with the value from the next row |
| bool() | Returns the Boolean value of the DataFrame |
| columns | Returns the column labels of the DataFrame |
| combine() | Compare the values in two DataFrames, and let a function decide which values to keep |
| combine_first() | Compare two DataFrames, and if the first DataFrame has a NULL value, it will be filled with the respective value from the second DataFrame |
| compare() | Compare two DataFrames and return the differences |
| convert_dtypes() | Converts the columns in the DataFrame into new dtypes |
| corr() | Find the correlation (relationship) between each column |
| count() | Returns the number of not empty cells for each column/row |
| cov() | Find the covariance of the columns |
| copy() | Returns a copy of the DataFrame |
| cummax() | Calculate the cumulative maximum values of the DataFrame |
| cummin() | Calculate the cumulative minmum values of the DataFrame |
| cumprod() | Calculate the cumulative product over the DataFrame |
| cumsum() | Calculate the cumulative sum over the DataFrame |
| describe() | Returns a description summary for each column in the DataFrame |
| diff() | Calculate the difference between a value and the value of the same column in the previous row |
| div() | Divides the values of a DataFrame with the specified value(s) |
| dot() | Multiplies the values of a DataFrame with values from another array-like object, and add the result |
| drop() | Drops the specified rows/columns from the DataFrame |
| drop_duplicates() | Drops duplicate values from the DataFrame |
| droplevel() | Drops the specified index/column(s) |
| dropna() | Drops all rows that contains NULL values |
| dtypes | Returns the dtypes of the columns of the DataFrame |
| duplicated() | Returns True for duplicated rows, otherwise False |
| empty | Returns True if the DataFrame is empty, otherwise False |
| eq() | Returns True for values that are equal to the specified value(s), otherwise False |
| equals() | Returns True if two DataFrames are equal, otherwise False |
| eval | Evaluate a specified string |
| explode() | Converts each element into a row |
| ffill() | Replaces NULL values with the value from the previous row |
| fillna() | Replaces NULL values with the specified value |
| filter() | Filter the DataFrame according to the specified filter |
| first() | Returns the first rows of a specified date selection |
| floordiv() | Divides the values of a DataFrame with the specified value(s), and floor the values |
| ge() | Returns True for values greater than, or equal to the specified value(s), otherwise False |
| get() | Returns the item of the specified key |
| groupby() | Groups the rows/columns into specified groups |
| gt() | Returns True for values greater than the specified value(s), otherwise False |
| head() | Returns the header row and the first 10 rows, or the specified number of rows |
| iat | Get or set the value of the item in the specified position |
| idxmax() | Returns the label of the max value in the specified axis |
| idxmin() | Returns the label of the min value in the specified axis |
| iloc | Get or set the values of a group of elements in the specified positions |
| index | Returns the row labels of the DataFrame |
| infer_objects() | Change the dtype of the columns in the DataFrame |
| info() | Prints information about the DataFrame |
| insert() | Insert a column in the DataFrame |
| interpolate() | Replaces not-a-number values with the interpolated method |
| isin() | Returns True if each elements in the DataFrame is in the specified value |
| isna() | Finds not-a-number values |
| isnull() | Finds NULL values |
| items() | Iterate over the columns of the DataFrame |
| iteritems() | Iterate over the columns of the DataFrame |
| iterrows() | Iterate over the rows of the DataFrame |
| itertuples() | Iterate over the rows as named tuples |
| join() | Join columns of another DataFrame |
| last() | Returns the last rows of a specified date selection |
| le() | Returns True for values less than, or equal to the specified value(s), otherwise False |
| loc | Get or set the value of a group of elements specified using their labels |
| lt() | Returns True for values less than the specified value(s), otherwise False |
| keys() | Returns the keys of the info axis |
| kurtosis() | Returns the kurtosis of the values in the specified axis |
| mask() | Replace all values where the specified condition is True |
| max() | Return the max of the values in the specified axis |
| mean() | Return the mean of the values in the specified axis |
| median() | Return the median of the values in the specified axis |
| melt() | Reshape the DataFrame from a wide table to a long table |
| memory_usage() | Returns the memory usage of each column |
| merge() | Merge DataFrame objects |
| min() | Returns the min of the values in the specified axis |
| mod() | Modules (find the remainder) of the values of a DataFrame |
| mode() | Returns the mode of the values in the specified axis |
| mul() | Multiplies the values of a DataFrame with the specified value(s) |
| ndim | Returns the number of dimensions of the DataFrame |
| ne() | Returns True for values that are not equal to the specified value(s), otherwise False |
| nlargest() | Sort the DataFrame by the specified columns, descending, and return the specified number of rows |
| notna() | Finds values that are not not-a-number |
| notnull() | Finds values that are not NULL |
| nsmallest() | Sort the DataFrame by the specified columns, ascending, and return the specified number of rows |
| nunique() | Returns the number of unique values in the specified axis |
| pct_change() | Returns the percentage change between the previous and the current value |
| pipe() | Apply a function to the DataFrame |
| pivot() | Re-shape the DataFrame |
| pivot_table() | Create a spreadsheet pivot table as a DataFrame |
| pop() | Removes an element from the DataFrame |
| pow() | Raise the values of one DataFrame to the values of another DataFrame |
| prod() | Returns the product of all values in the specified axis |
| product() | Returns the product of the values in the specified axis |
| quantile() | Returns the values at the specified quantile of the specified axis |
| query() | Query the DataFrame |
| radd() | Reverse-adds the values of one DataFrame with the values of another DataFrame |
| rdiv() | Reverse-divides the values of one DataFrame with the values of another DataFrame |
| reindex() | Change the labels of the DataFrame |
| reindex_like() | ?? |
| rename() | Change the labels of the axes |
| rename_axis() | Change the name of the axis |
| reorder_levels() | Re-order the index levels |
| replace() | Replace the specified values |
| reset_index() | Reset the index |
| rfloordiv() | Reverse-divides the values of one DataFrame with the values of another DataFrame |
| rmod() | Reverse-modules the values of one DataFrame to the values of another DataFrame |
| rmul() | Reverse-multiplies the values of one DataFrame with the values of another DataFrame |
| round() | Returns a DataFrame with all values rounded into the specified format |
| rpow() | Reverse-raises the values of one DataFrame up to the values of another DataFrame |
| rsub() | Reverse-subtracts the values of one DataFrame to the values of another DataFrame |
| rtruediv() | Reverse-divides the values of one DataFrame with the values of another DataFrame |
| sample() | Returns a random selection elements |
| sem() | Returns the standard error of the mean in the specified axis |
| select_dtypes() | Returns a DataFrame with columns of selected data types |
| shape | Returns the number of rows and columns of the DataFrame |
| set_axis() | Sets the index of the specified axis |
| set_flags() | Returns a new DataFrame with the specified flags |
| set_index() | Set the Index of the DataFrame |
| size | Returns the number of elements in the DataFrame |
| skew() | Returns the skew of the values in the specified axis |
| sort_index() | Sorts the DataFrame according to the labels |
| sort_values() | Sorts the DataFrame according to the values |
| squeeze() | Converts a single column DataFrame into a Series |
| stack() | Reshape the DataFrame from a wide table to a long table |
| std() | Returns the standard deviation of the values in the specified axis |
| sum() | Returns the sum of the values in the specified axis |
| sub() | Subtracts the values of a DataFrame with the specified value(s) |
| swaplevel() | Swaps the two specified levels |
| T | Turns rows into columns and columns into rows |
| tail() | Returns the headers and the last rows |
| take() | Returns the specified elements |
| to_xarray() | Returns an xarray object |
| transform() | Execute a function for each value in the DataFrame |
| transpose() | Turns rows into columns and columns into rows |
| truediv() | Divides the values of a DataFrame with the specified value(s) |
| truncate() | Removes elements outside of a specified set of values |
| update() | Update one DataFrame with the values from another DataFrame |
| value_counts() | Returns the number of unique rows |
| values | Returns the DataFrame as a NumPy array |
| var() | Returns the variance of the values in the specified axis |
| where() | Replace all values where the specified condition is False |
| xs() | Returns the cross-section of the DataFrame |
| __iter__() | Returns an iterator of the info axes |
'교육 > 파이썬빅데이터분석교육' 카테고리의 다른 글
| 파이썬 판다스의 이해4 - pandas plotting (0) | 2022.12.08 |
|---|---|
| 파이썬 판다스의 이해2 - Pandas Cleaning (0) | 2022.12.08 |
| 빅데이터로 보는 윤석열대통령! 100일(2022년 8월)웹크룰링, 워드크라우드 (0) | 2022.08.22 |
| 테슬라 주가와 구글검색 빅데이터관계를 통해 살펴보는 주가흐름?! (0) | 2022.08.21 |
| AI 빅데이터, 텍스트 마이닝기법을 이용한 소비자 감성분석( 파이썬활용) (0) | 2022.08.14 |